How to use data in D3 (d3.js)
Order data for your area of interest in GeoJSON format.
Go to the orders page and download the archive when it’s complete.
Unpack the archive.
Select target layer, for example municipal boundaries (boundary-polygon-lvl6.geojson)
To use layer in Leaflet first you need to host it (store in a place, accessible via hyperlink).
Simple Leaflet map showing a municipal boundaries layer:
 <!DOCTYPE html>
 <html>

   <head>
     <meta charset="utf-8" />
     <meta name="viewport" content="width=device-width, initial-scale=1" />
     <title>Show Data layer on the D3</title>

   <script src="https://cdnjs.cloudflare.com/ajax/libs/d3/7.3.0/d3.min.js"></script>
   <style>
     #content .map path {
       fill: #aaa;
       stroke: #fff;
     }
   </style>
 </head>

 <body>
   <div id="content">
     <svg width="620px" height="600px">
       <g class="map"></g>
     </svg>
   </div>
   <script>
     const url =
       "https://raw.githubusercontent.com/rendrom/rendrom.github.io/master/static/boundary-polygon-lvl6.geojson";

     // scale - Scale factor of the projection
     // center - Projection center [longitude, latitude]
     // translate - Pixel [x,y] location of the projection center
     let projection = d3
       .geoMercator()
       .scale(10000)
       .translate([200, 280])
       .center([39.5, 44.3]);

     let geoGenerator = d3.geoPath().projection(projection);

     function handleMouseover(e, d) {
       let pixelArea = geoGenerator.area(d);
       let bounds = geoGenerator.bounds(d);
       let centroid = geoGenerator.centroid(d);
       let measure = geoGenerator.measure(d);

       d3.select("#content .info").text(
         d.properties.NAME +
           " (path.area = " +
           pixelArea.toFixed(1) +
           " path.measure = " +
           measure.toFixed(1) +
           ")"
       );

       d3.select("#content .bounding-box rect")
         .attr("x", bounds[0][0])
         .attr("y", bounds[0][1])
         .attr("width", bounds[1][0] - bounds[0][0])
         .attr("height", bounds[1][1] - bounds[0][1]);

       d3.select("#content .centroid")
         .style("display", "inline")
         .attr("transform", "translate(" + centroid + ")");
     }

     // Helper function to reverse coordinates if the polygon's area is negative
     function fixCoordinates(coordinates) {
       return coordinates.map(function (ring) {
         if (d3.polygonArea(ring) < 0) {
           return ring.reverse();
         }
         return ring;
       });
     }

     function update(features) {
       features.forEach(function (feature) {
         const geometryType = feature.geometry.type;
         const coordinates = feature.geometry.coordinates;

         if (geometryType === "Polygon") {
           feature.geometry.coordinates = fixCoordinates(coordinates);
         } else if (geometryType === "MultiPolygon") {
           feature.geometry.coordinates = coordinates.map(fixCoordinates);
         }
       });

       let u = d3.select("#content g.map").selectAll("path").data(features);

       u.enter()
         .append("path")
         .attr("d", geoGenerator)
         .on("mouseover", handleMouseover);
     }

     // REQUEST DATA
     d3.json(url).then(function (json) {
       update(json.features);
     });
   </script>
 </body>
</html>
An extended example can be found here
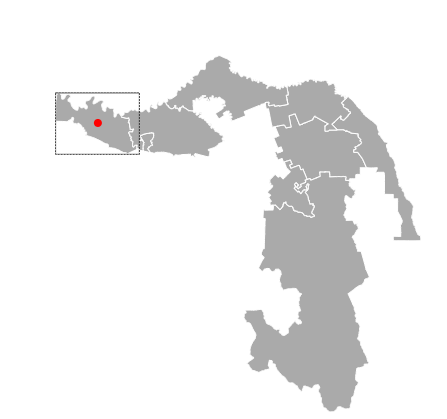
The result: