How to upload data to Yandex DataLens
Prepare the file
Order data for your area of interest, for example in GeoPackage format. Most likely the product you need is the Basemap.
Go to the orders page and download the archive when it’s complete.
Unpack the archive.
Select the layer, for example, administrative boundaries of the counties (boundary-polygon-lvl6) or settlements (settlement-point).
Use the free online converter to prepare vector layer for DataLens by converting it to a fitting format. The output of this converter is a CSV file.
Upload to DataLens
Create connection
On the main page of the DataLens service click Connections: Create. Then select Files and services --> Files.
In the top left corner click Upload files.
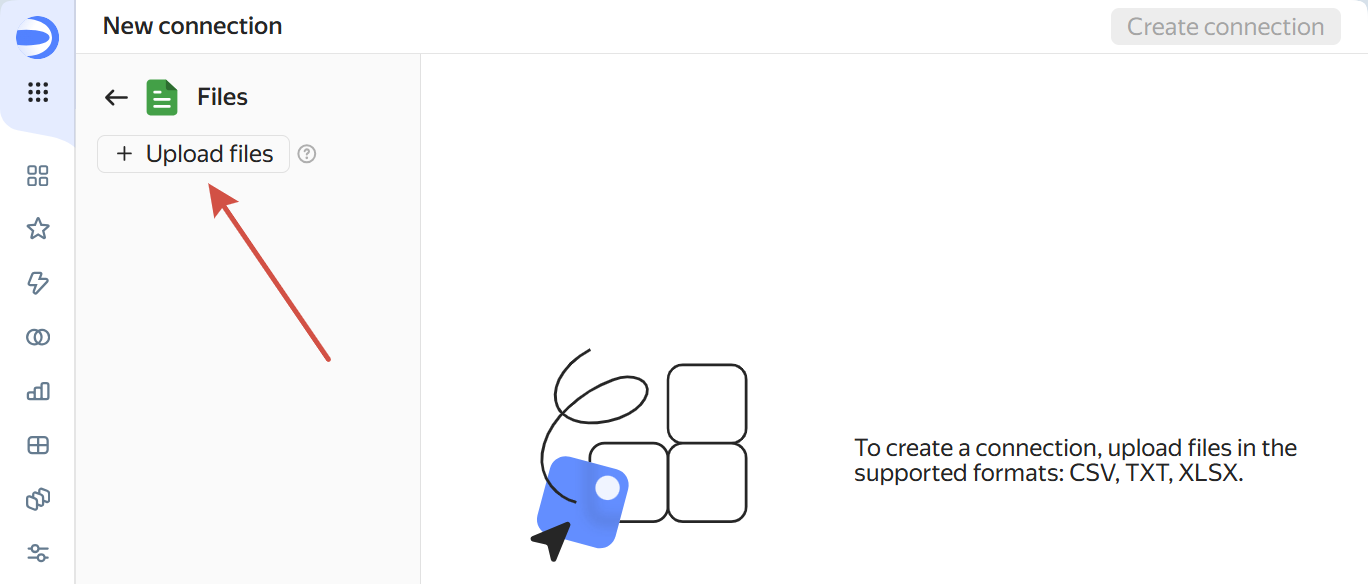
Uploading file
After the file is uploaded, click Create connection in the top right corner.
Note
Make sure that the “Columns header” is set to “Yes”.
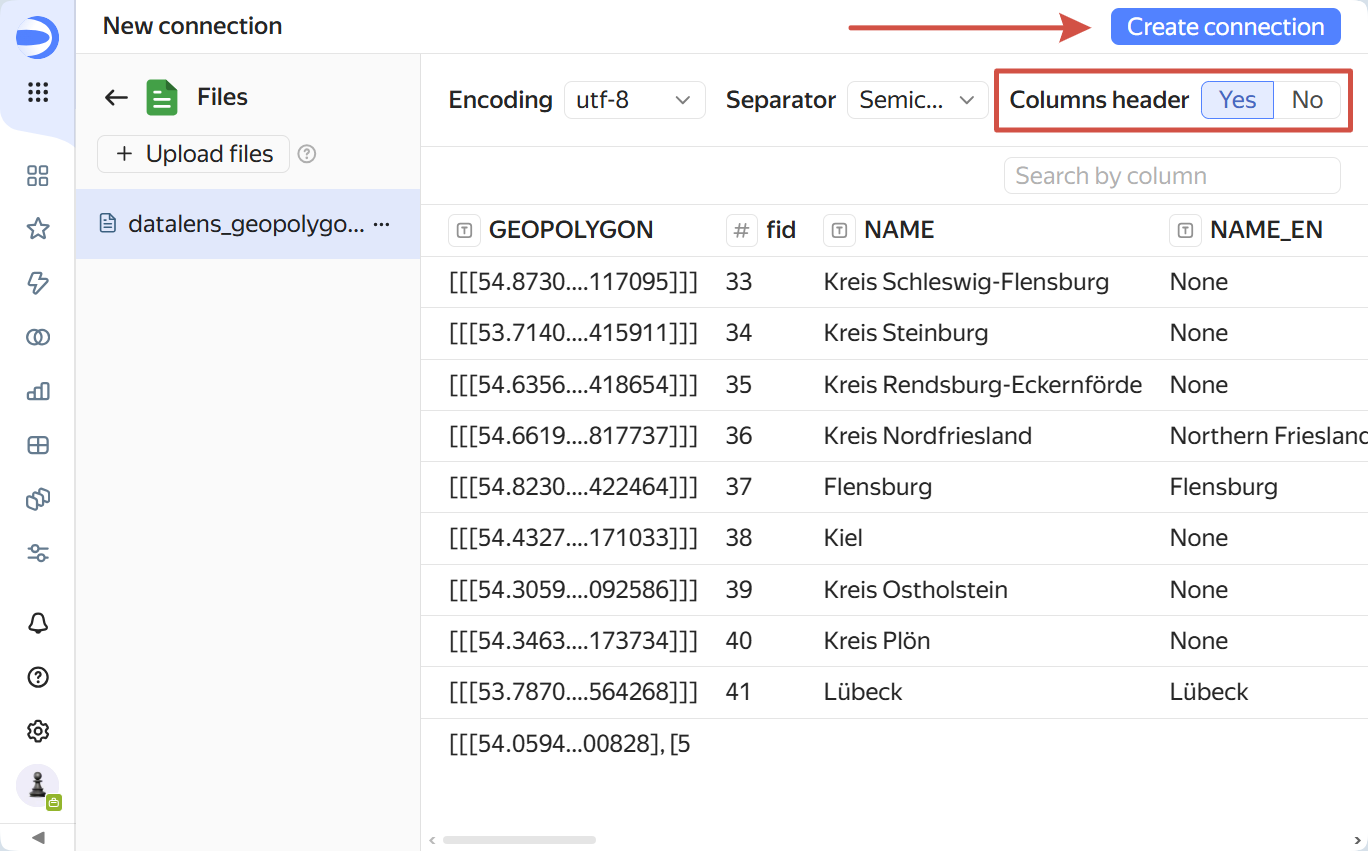
Creating connection
Choose a workbook or create a new one. After selecting a workbook, click Create, enter the name for the new connection in the pop-up dialog and click Create in that dialog.
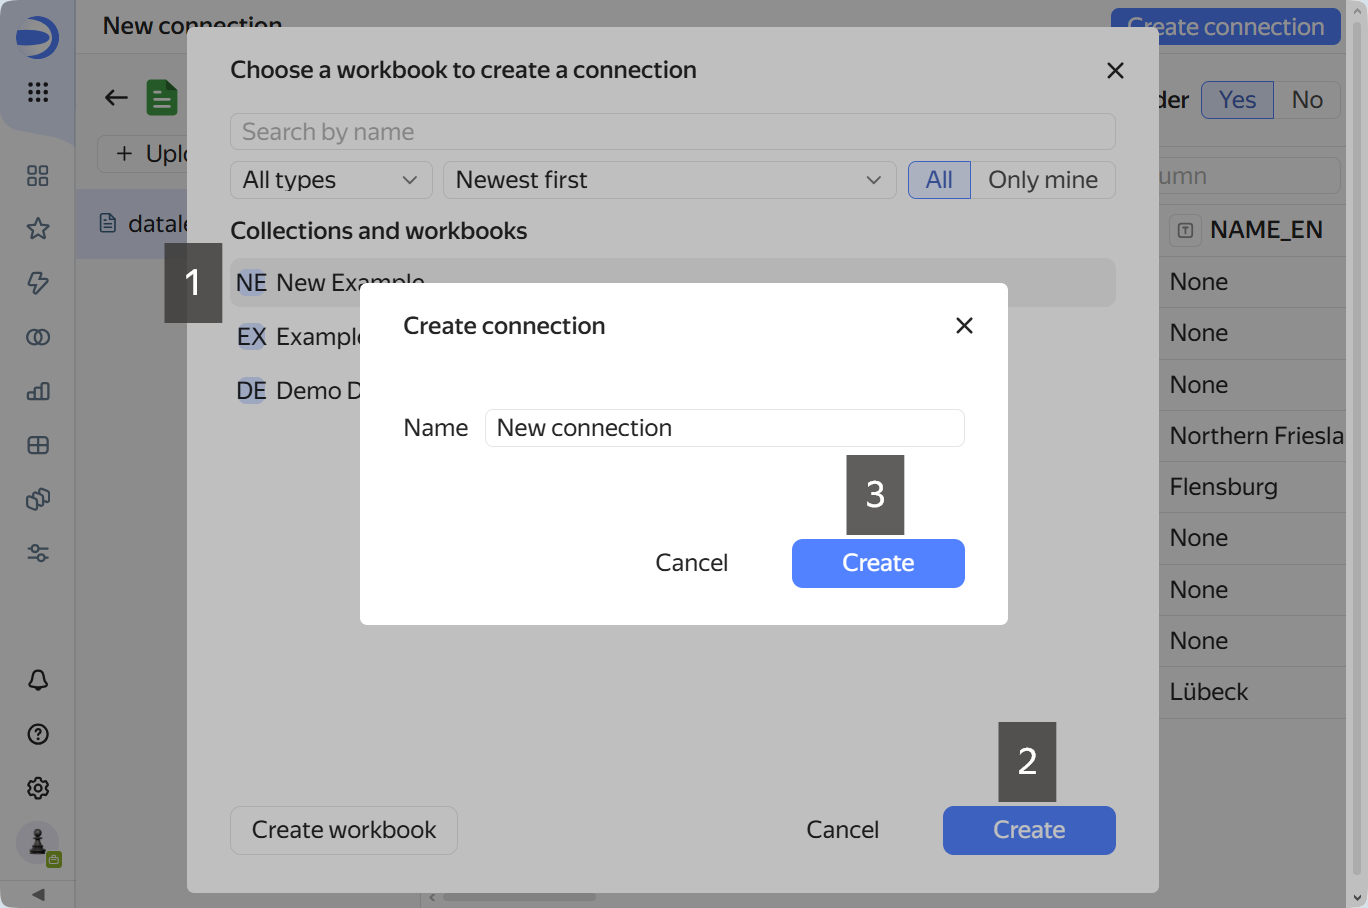
Selecting workbook and entering connection name
Create dataset
Click Create dataset in top right corner and select the connection you’ve just created.
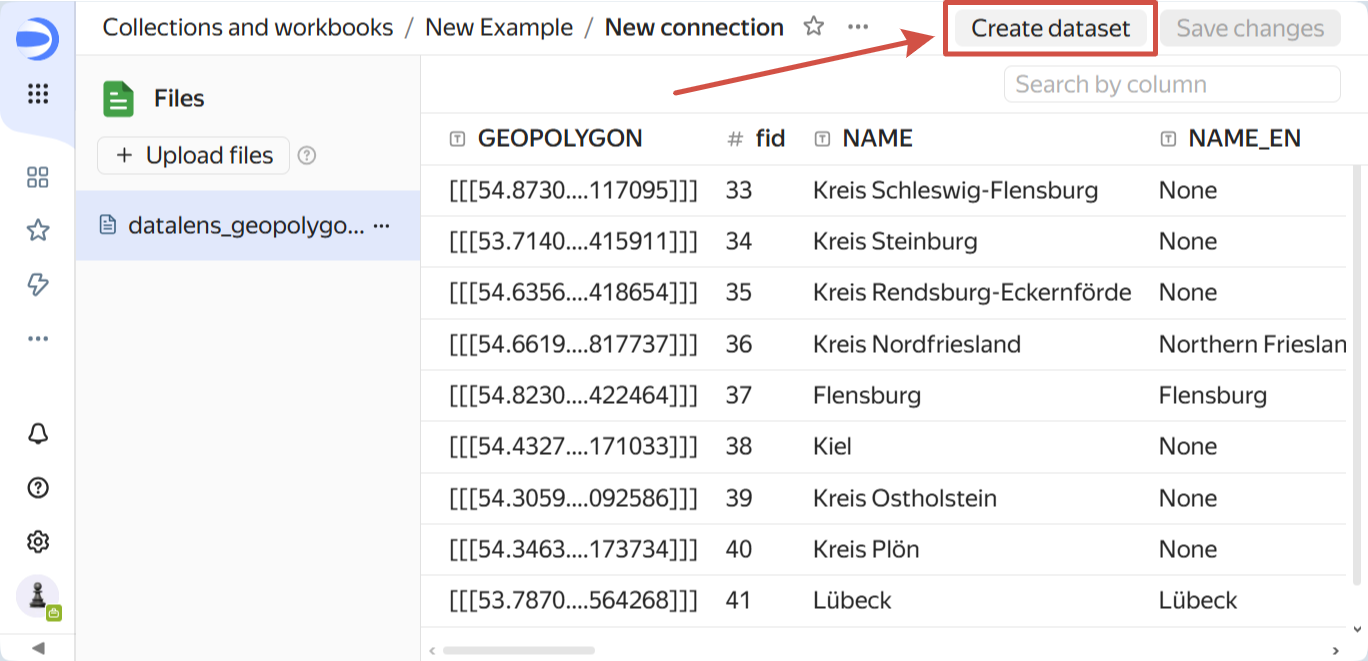
Creating a dataset
Go to the “Fields” tab. For the first field, set the type to Geopolygon / Geopoints using the dropdown menu.
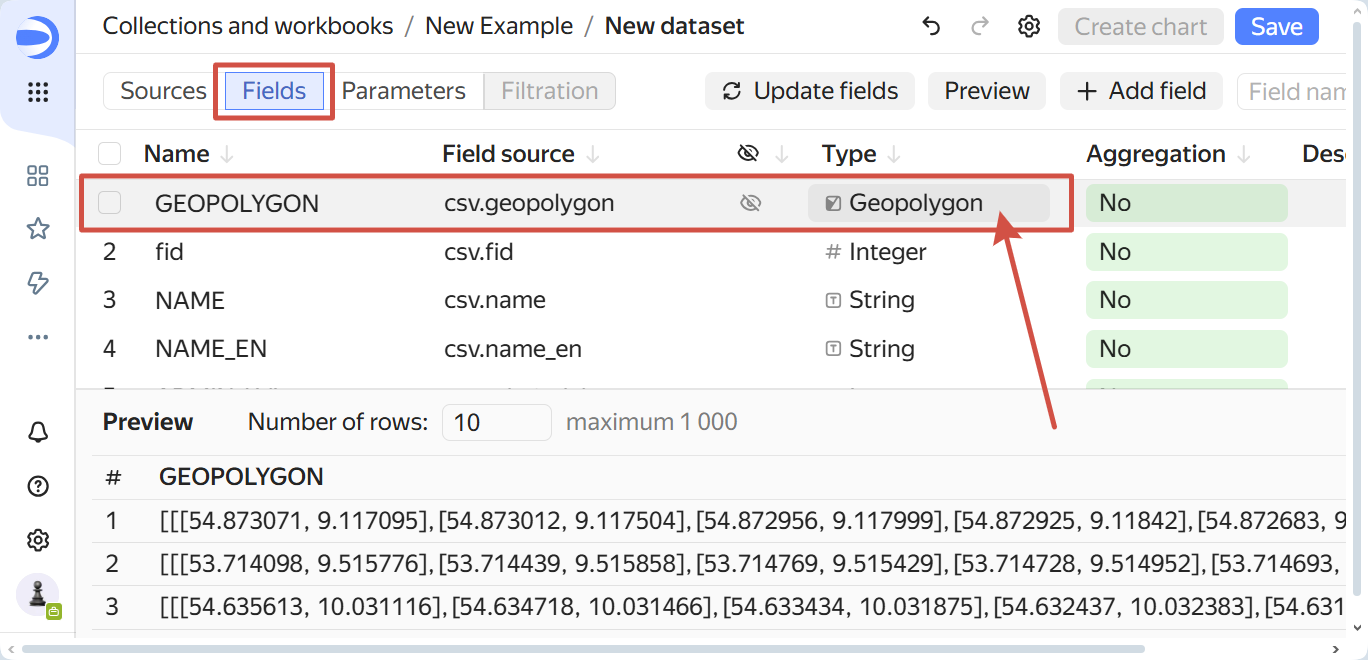
Field settings
Click Save in the top right corner. Enter a name for the new dataset and save it.
Create a chart
After the dataset is created, the button Create chart in the top right corner becomes active. Click it to create a new chart.
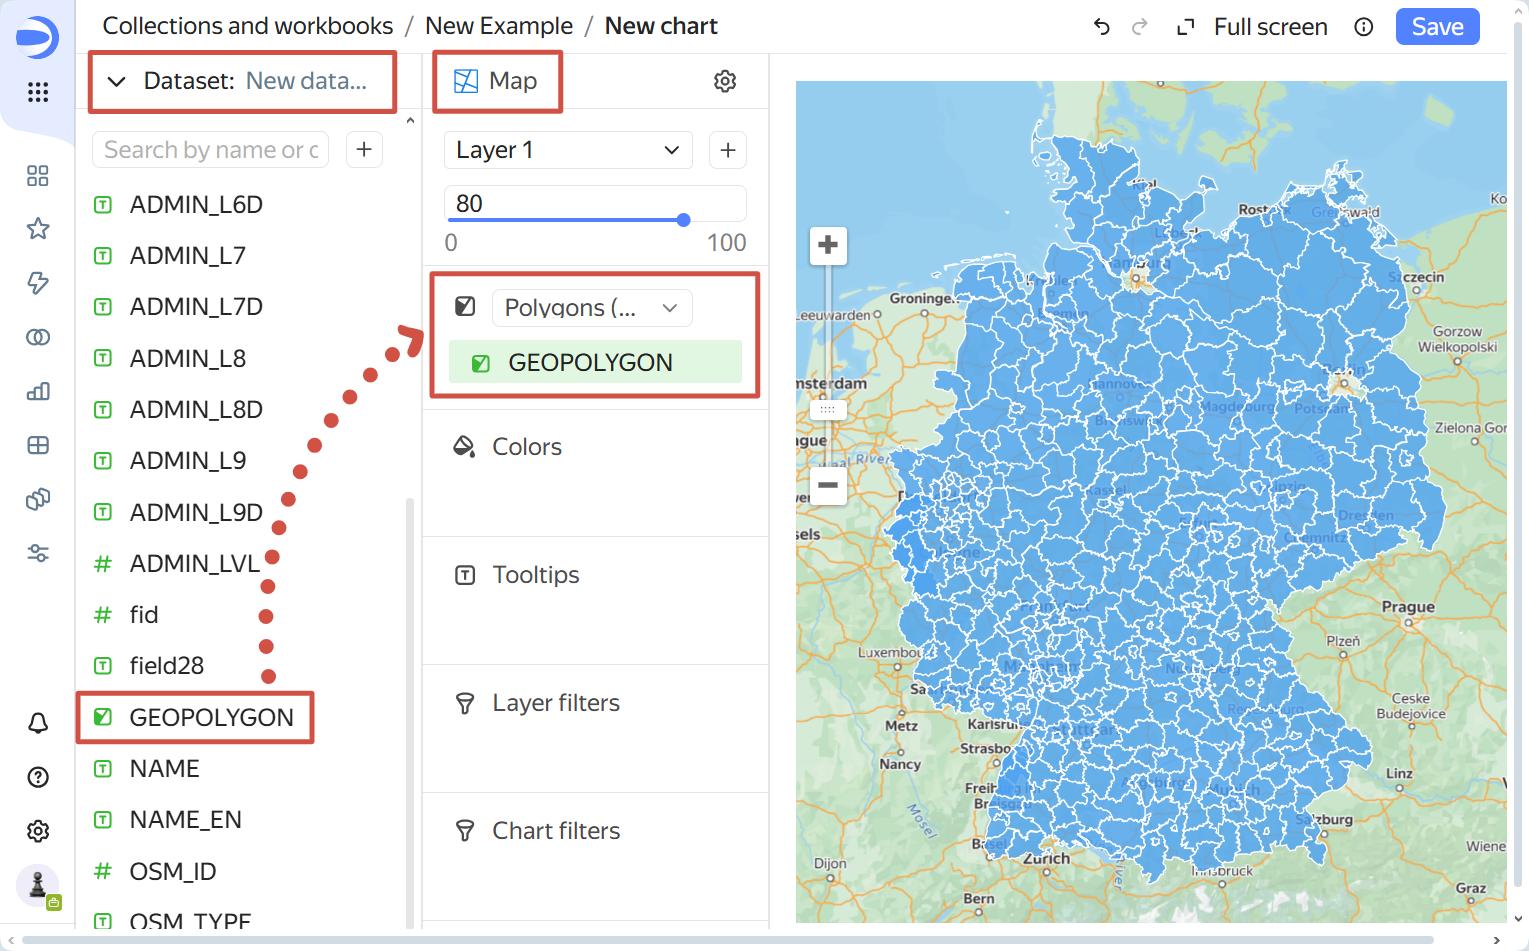
Creating a chart
Select your dataset in the dropdown menu on the left.
In the section to the right use the dropdown menu to select Map as the chart type.
Below choose the field type in the dropdown menu so that it matches the geometry of your layer: Polygons (Geopolygons) or Points (Geopoints).
Drag the Geopolygon/Geopoint field to the “Polygons”/”Points” section to create the visualization.
Click Create button in the top right corner. Enter the name for the chart (the default value is ‘Dataset name - Map’) and save it.
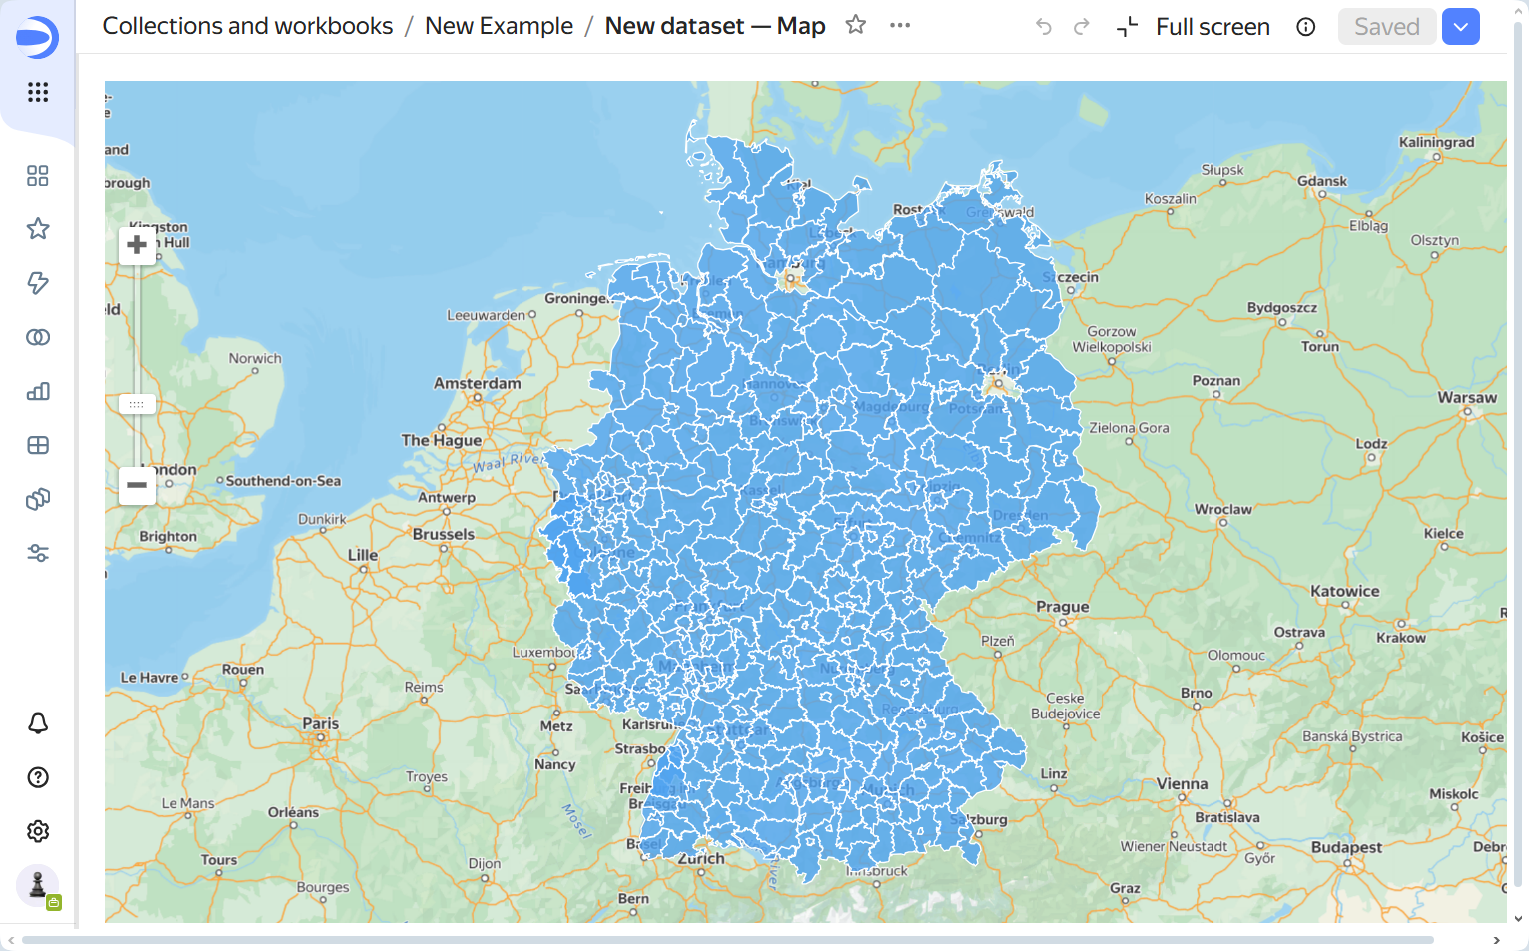
Resulting map