How to vizualize data with Highcharts Maps (highcharts.js)
Order data for your area of interest in GeoJSON format.
Go to the orders page and download the archive when it’s complete.
Unpack the archive.
Select a layer.
To add a layer to Highcharts Maps you need to host it first (i.e. put it in a place, accessible via hyperlink) and specify it’s location:
Highcharts.getJSON('https://cdn.jsdelivr.net/gh/highcharts/highcharts@v7.0.0/samples/data/germany.geo.json', function (geojson)
There are a lot of examples of data usage in Highcharts Maps documentation, source code is also available.
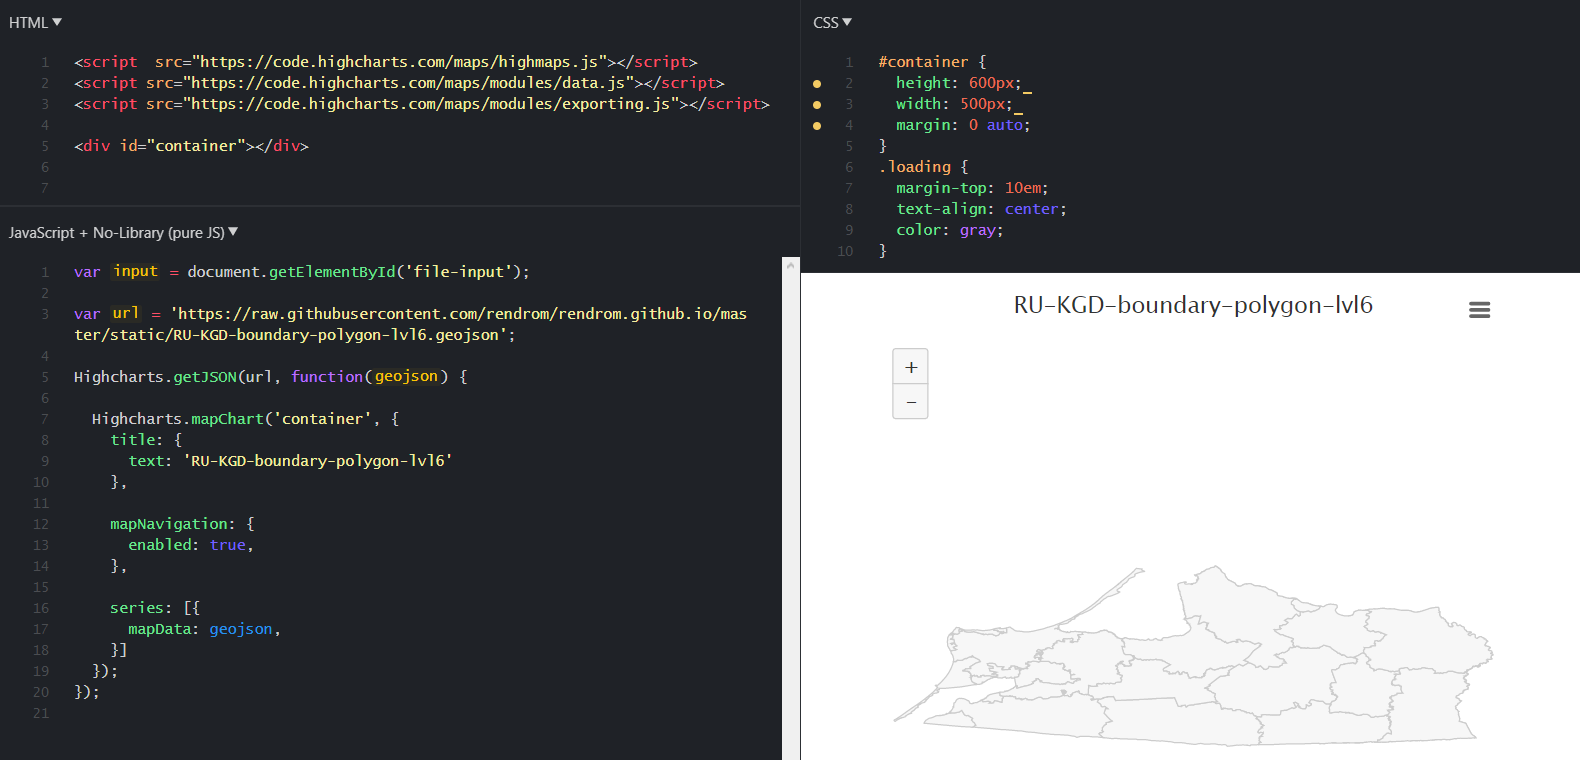
The example of NextGIS Data usage is presented below, see live example as well.
Note
Highcharts Maps library handles well fast visualization of spatial data statistics. However such libraries as Mapbox GL JS, Openlayers and Leaflet are better for interactive mapping. Examples of data upload from json files to forementioned libraries can be found here: https://jsfiddle.net/rendrom/a1xf63bk/ and https://jsfiddle.net/rendrom/yg6xz9kj/. NextGIS Frontend libraries are used for these examples.
Hint
For faster and better data rendering performans on the web, additional generalization, thinning and modification of initial data can be needed. The resulting file would be smaller in size, having less nodes in polygons and lines and wouldn’t contain unnecessary attributes.