How to use data in Leaflet (leaflet.js)
Order data for your area of interest in GeoJSON format.
Go to the orders page and download the archive when it’s complete.
Unpack the archive.
Select a target layer, for example municipal boundaries (boundary-polygon-lvl6.geojson)
To use layer in Leaflet first you need to host it (store in a place, accessible via hyperlink).
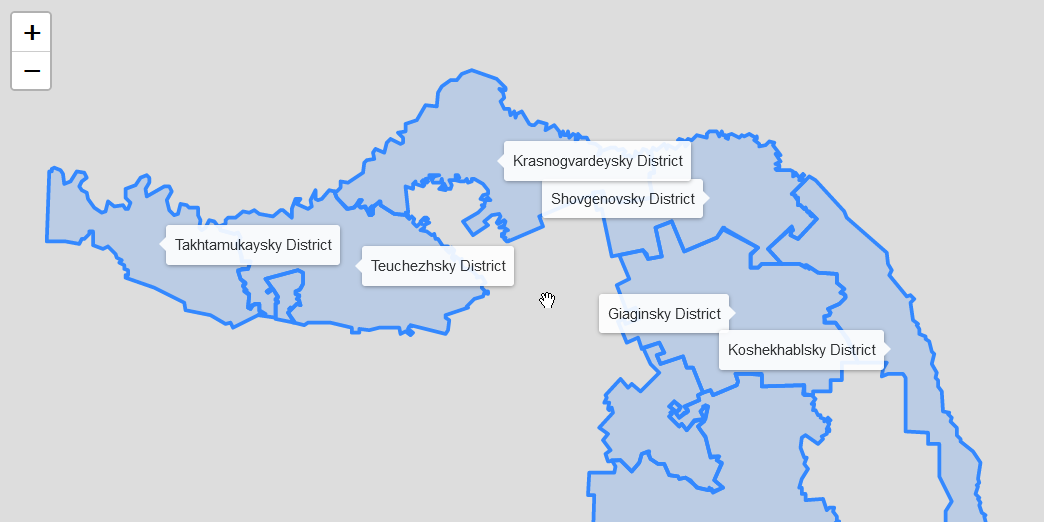
Simple Leaflet map showing a municipal boundaries layer and lables:
<!DOCTYPE html>
<html>

  <head>
    <meta charset="utf-8" />
    <meta http-equiv="X-UA-Compatible" content="IE=edge" />
    <meta name="viewport" content="width=device-width, initial-scale=1" />
    <title>Show Data layer on the Leaflet</title>

    <link rel="stylesheet" href="https://unpkg.com/leaflet@1.7.1/dist/leaflet.css" />
    <script src="https://unpkg.com/leaflet@1.7.1/dist/leaflet.js"></script>
    <style>
      html,
      body,
      #map {
        width: 100%;
        height: 100%;
      }

    </style>
  </head>

  <body>
    <div id="map"></div>
    <script>
      var dataMap = L.map("map").fitBounds([
        [43.6956, 38.5235],
        [45.2362, 41.1877],
      ]);
      fetch(
        "https://raw.githubusercontent.com/rendrom/rendrom.github.io/master/static/boundary-polygon-lvl6.geojson"
      ).then(function(resp) {
        resp.json().then(function(geojson) {
          L.geoJSON(geojson, {
            onEachFeature: function(feature, layer) {
              const name = feature.properties.NAME;
              if (name) {
                layer.bindTooltip(feature.properties.NAME, {
                  permanent: true
                });
              }
            },
          }).addTo(dataMap);
        });
      });

    </script>
  </body>
</html>
The result: