How to load vector layer into Microsoft Power BI
Order data for your area of interest, e.g. in GeoJSON (QGIS) format.
Go to the orders page and download the archive when it’s complete.
Unpack the archive.
Convert target layer to TopoJSON format. For the conversion you can use any online converter, for example, MapShaper.
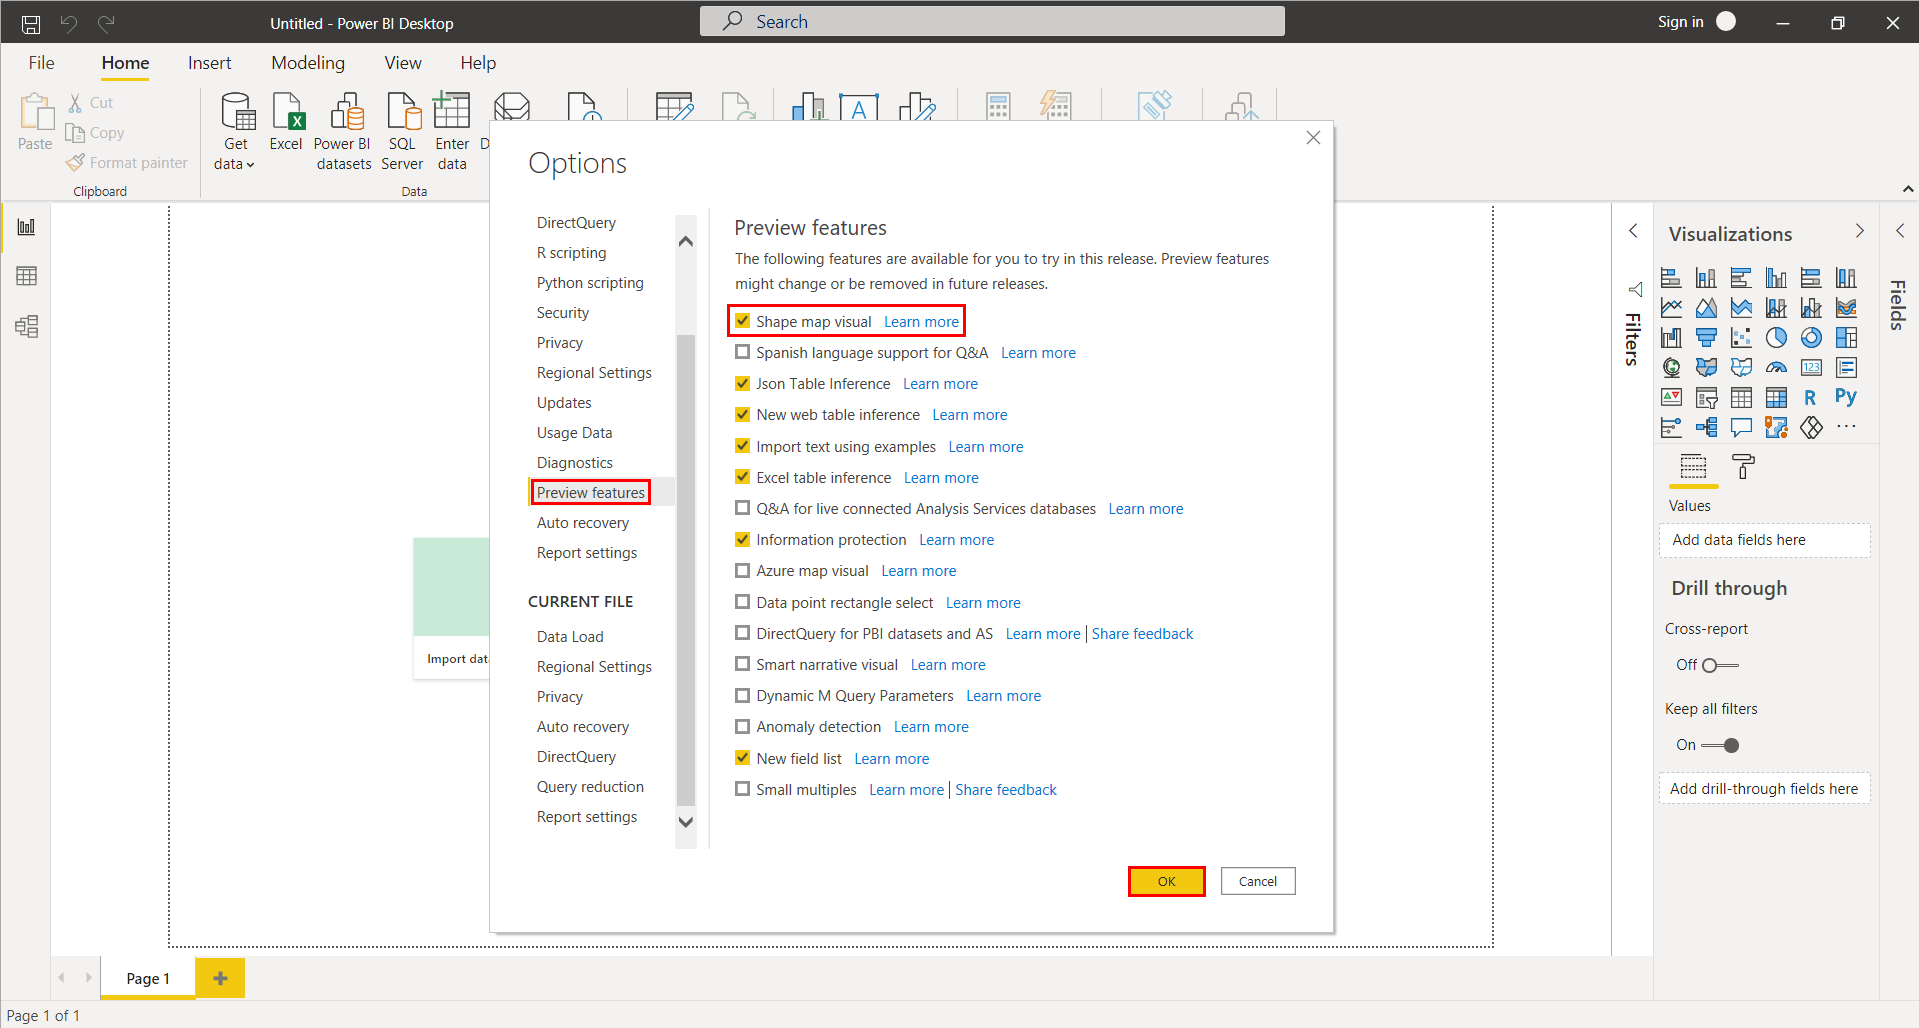
First you should activate Shape map visual. Select “File” > “Options and settings” > “Options”. In pop-up window select “Preview features” from the left list and then check the box next to “Shape map visual”. Press “OK”.
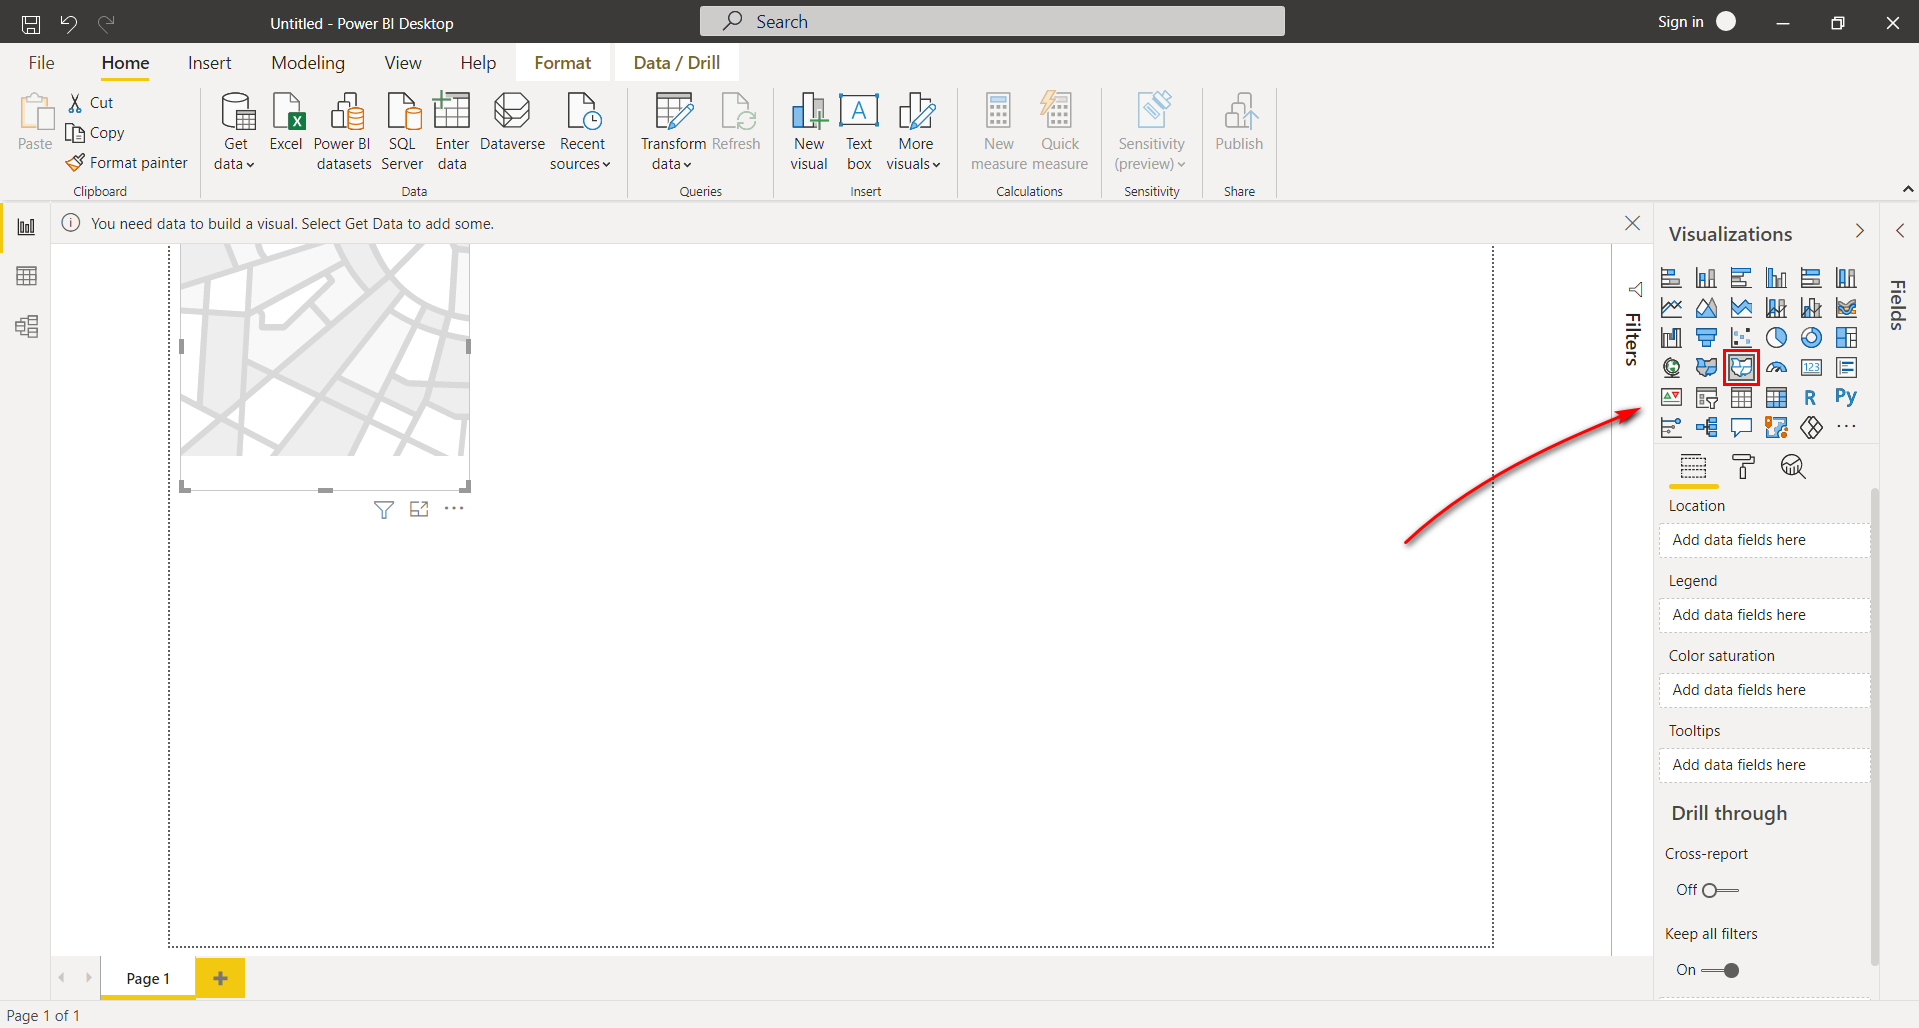
From “Visualizations” panel select Shape map icon. Template with map appears in the left corner of the main workspace.
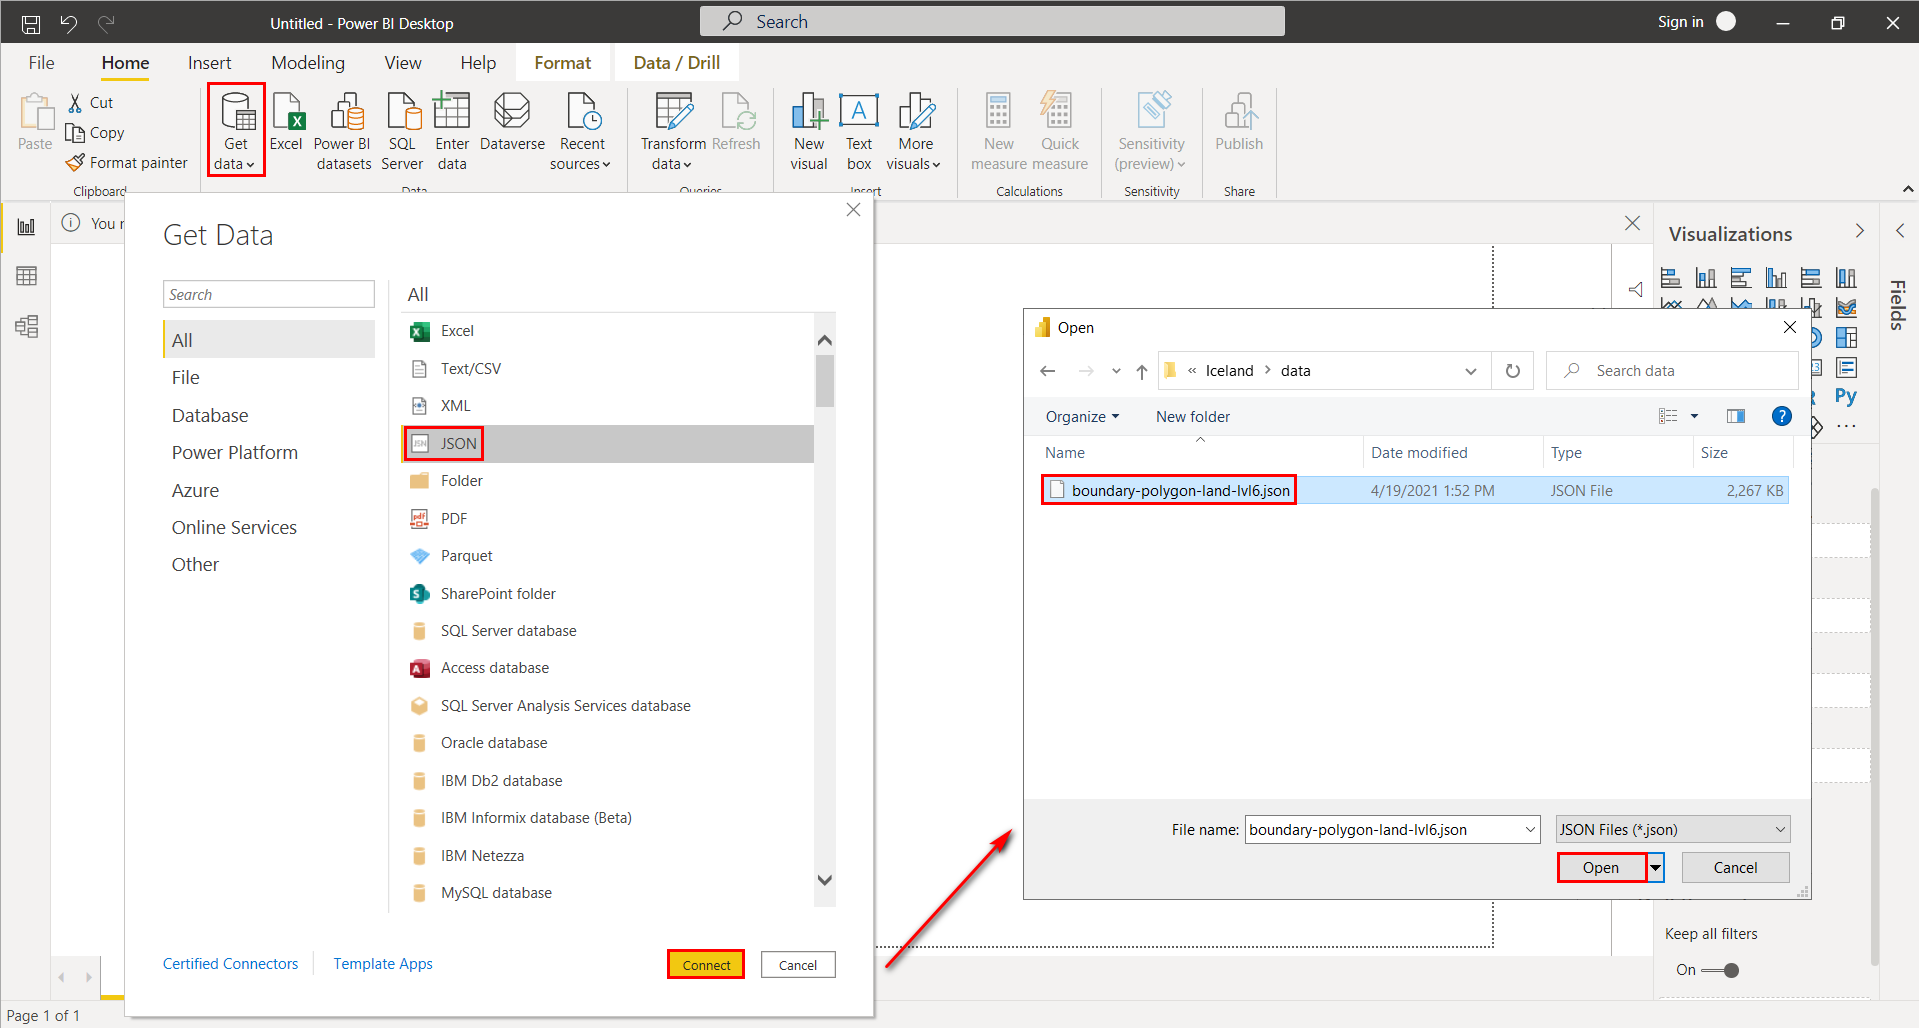
Let’s add prepared TopoJSON file into Power BI. From the main bar select “Get Data” > “All” > “JSON” and click on “Connect”. In the next pop-up window specify path to the targer TopoJSON, press “Open” button.
When file became uploaded, Query Editor Window appears. Here you can prepare data for better visualization. In the table find column with object geometries and double click on it.

Column with the objects expands in the lower part of the Query window. From the main menu select “Transform” > “Convert to list”.

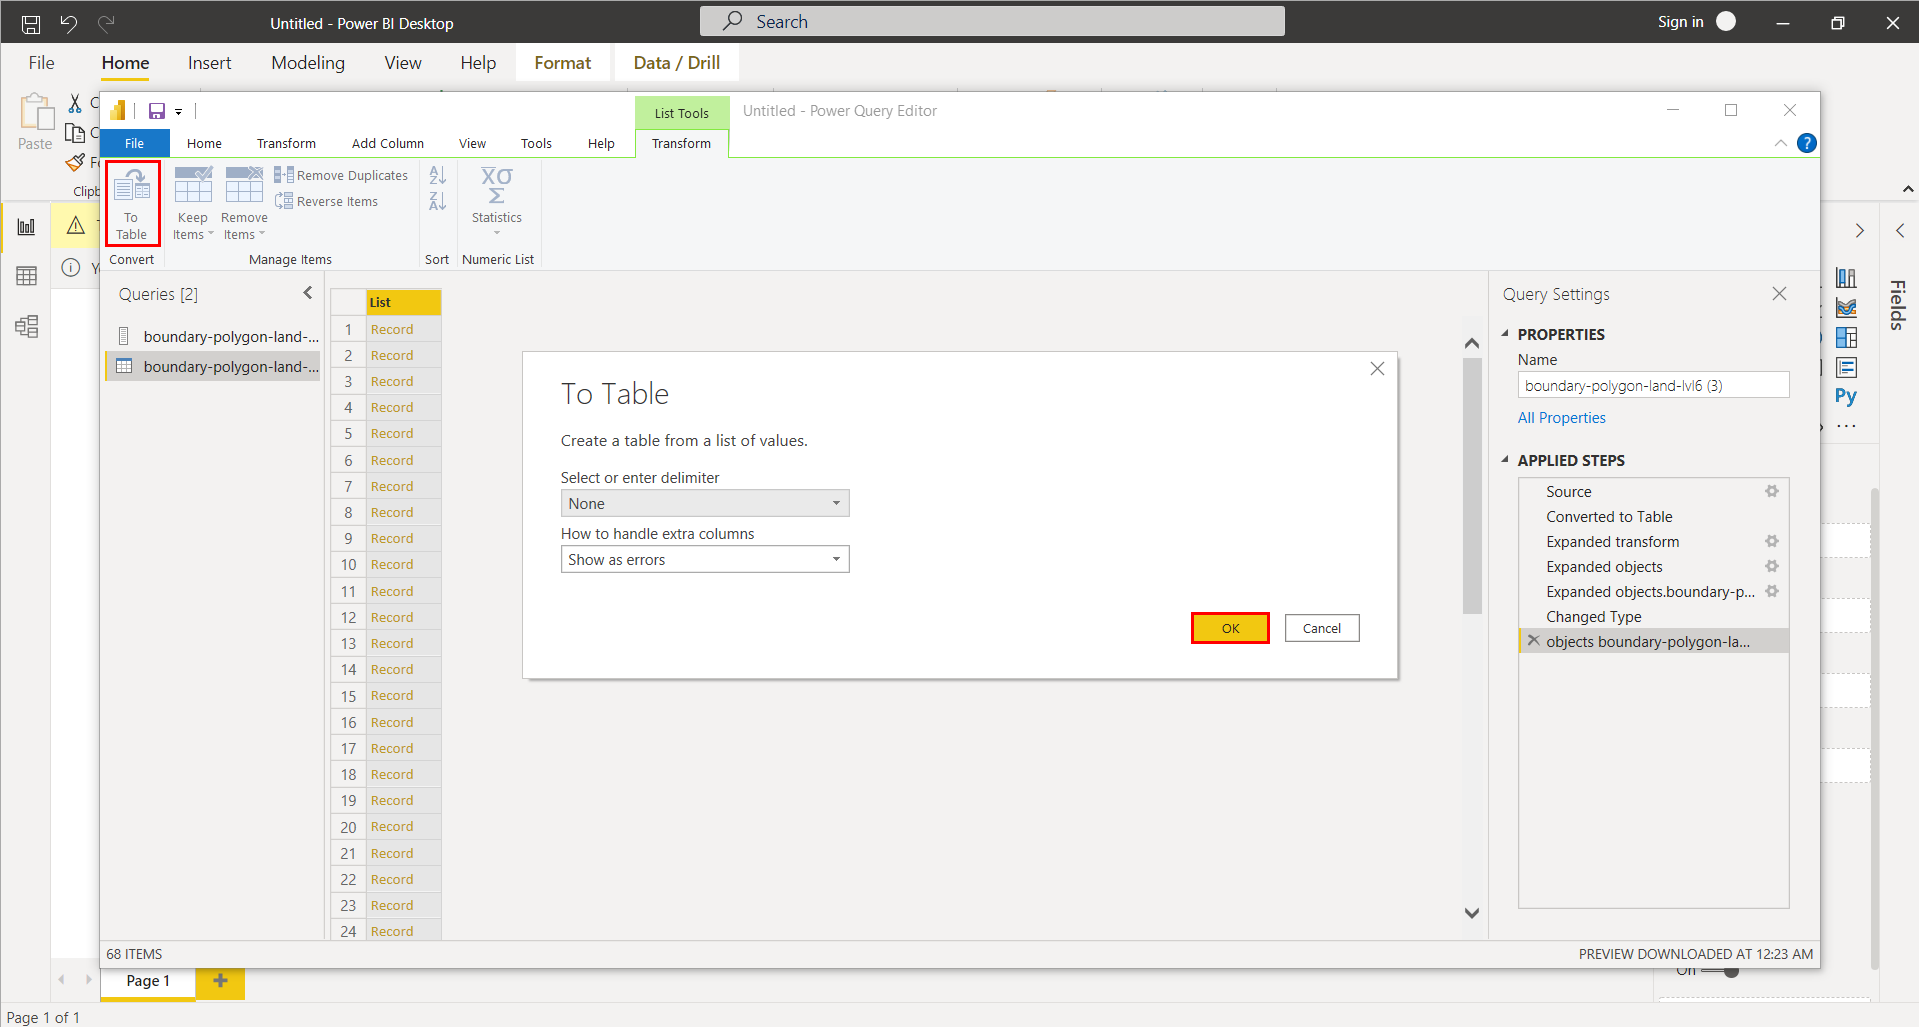
Now list with objects is presented separately. Let’s turn it into independent table. Select “Transform” > “To Table” and press “OK” in pop-up window.
In the new table set some parameters: press on the icon with forked arrow, and in the pop-up window check the box next to “properties”, press “OK”.
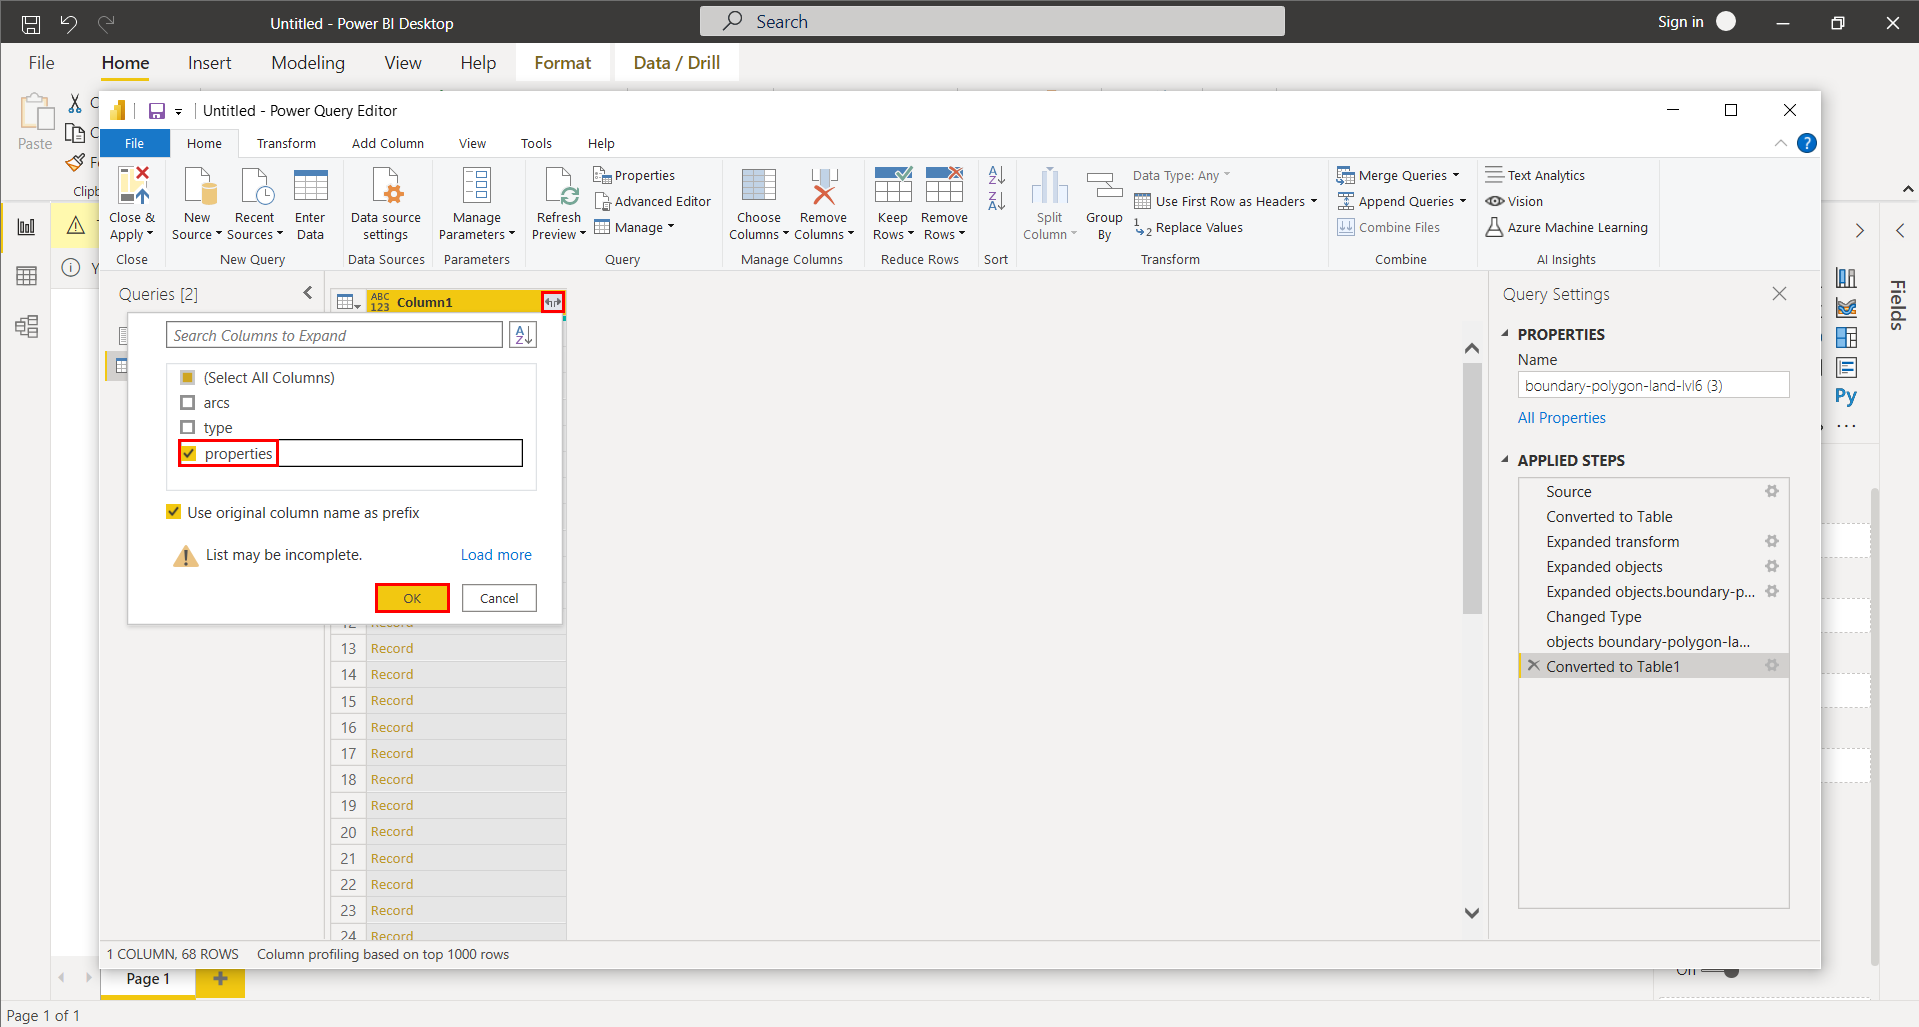
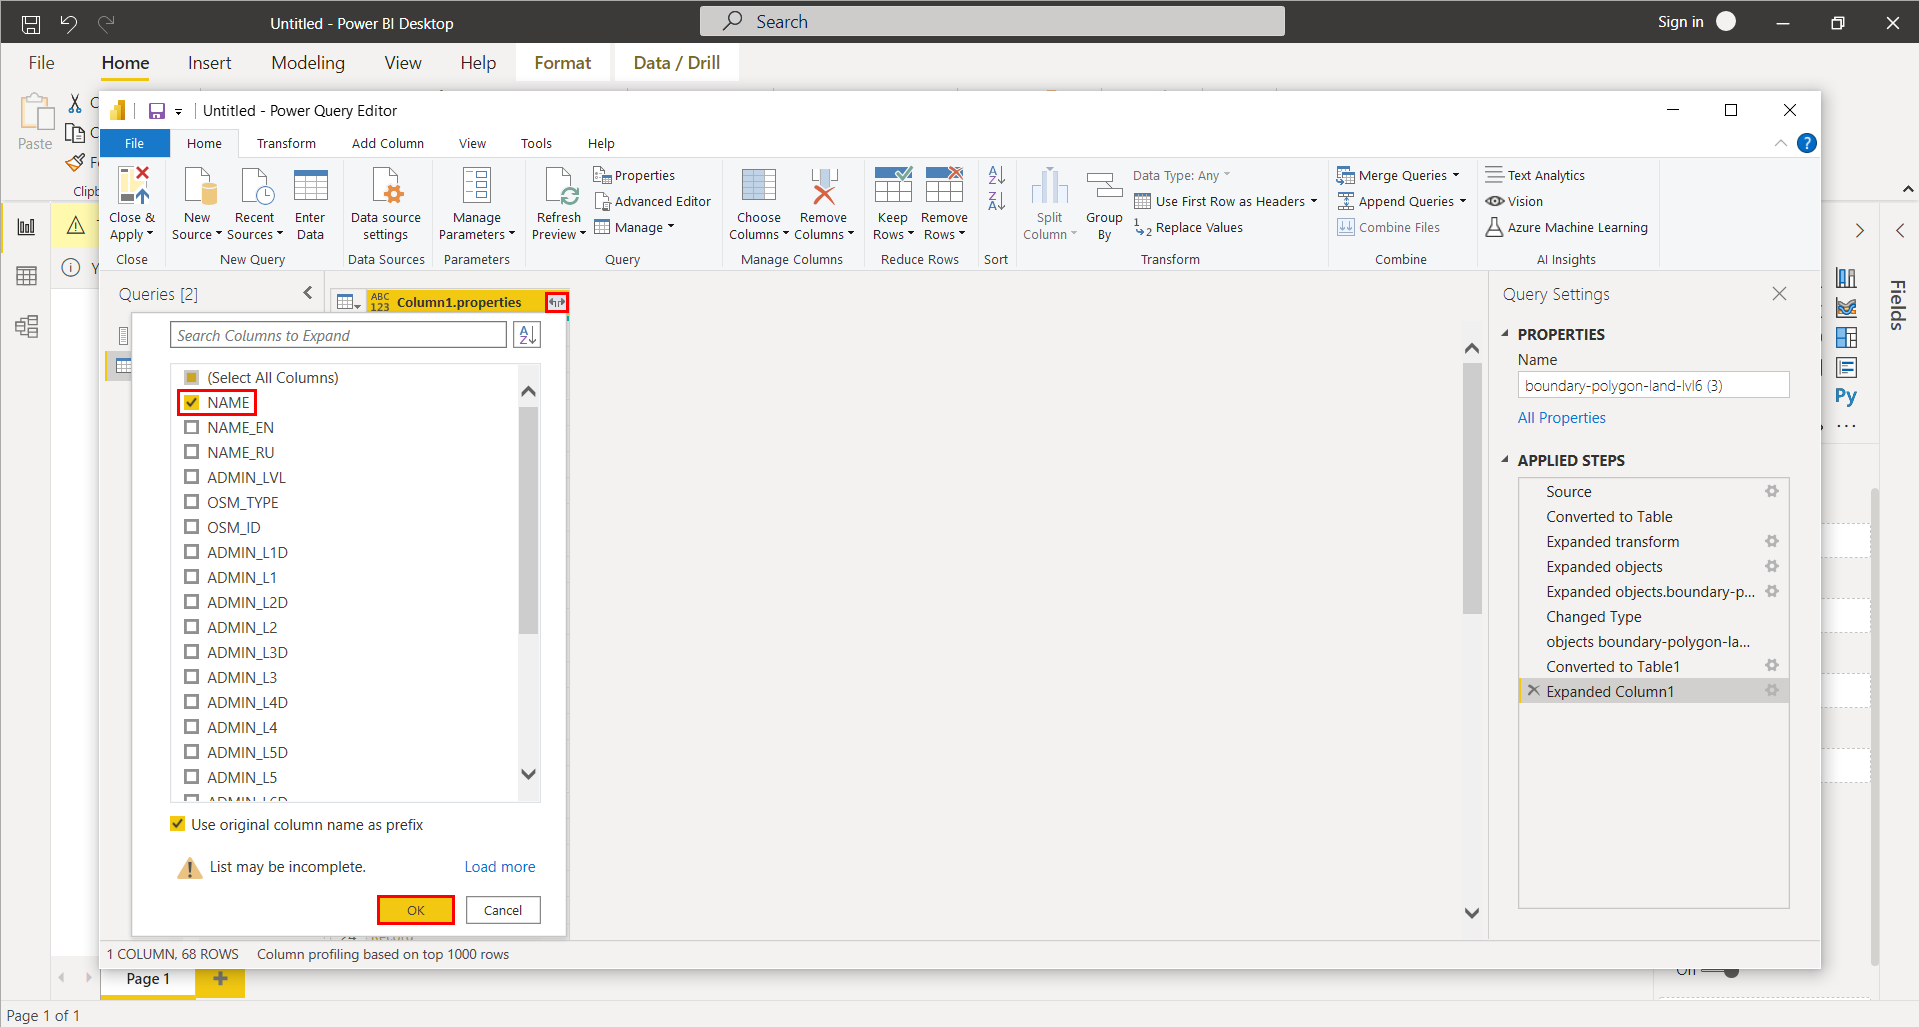
Table is transformed, in the header of the column again press on the icon with forked arrow and select attributes you want to visualize. Press “OK”.
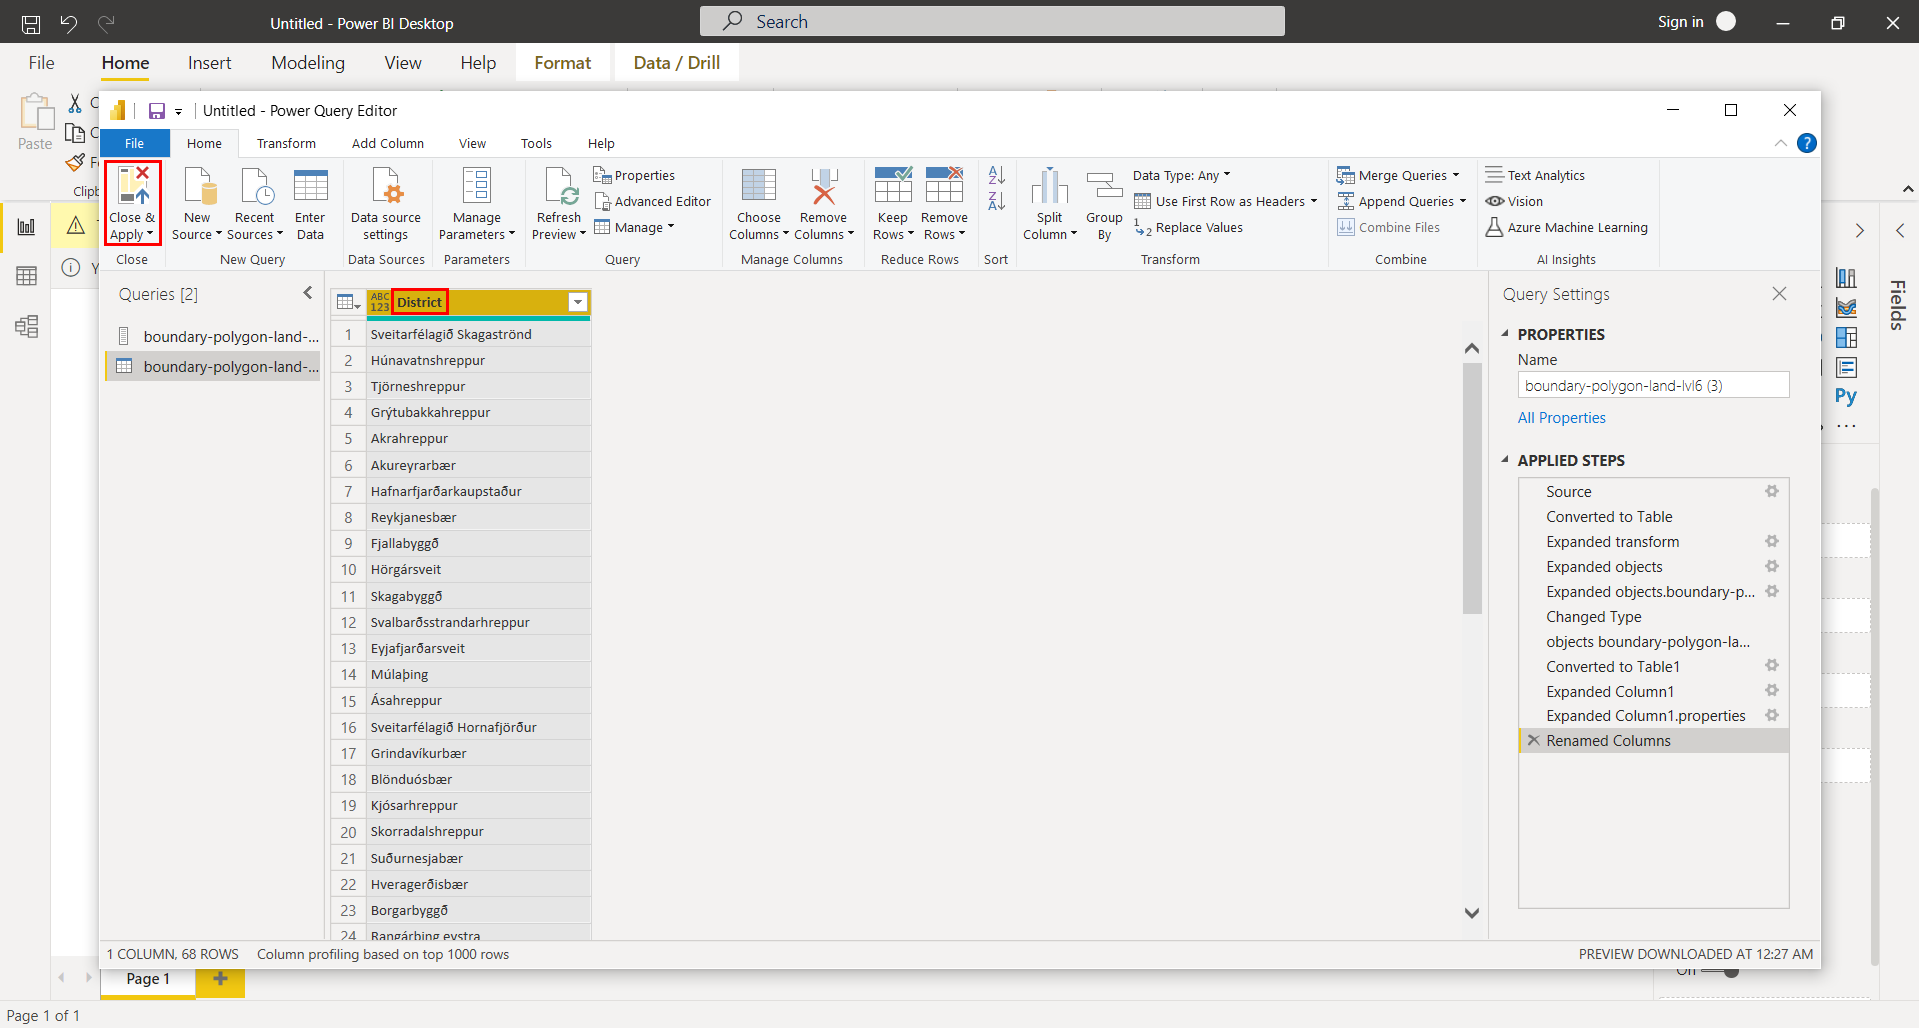
You can rename column and then select “Close & Apply” from menu bar.
Now data is ready for visualization. From the “Fields” panel select target field and drag it to “Location” gap.
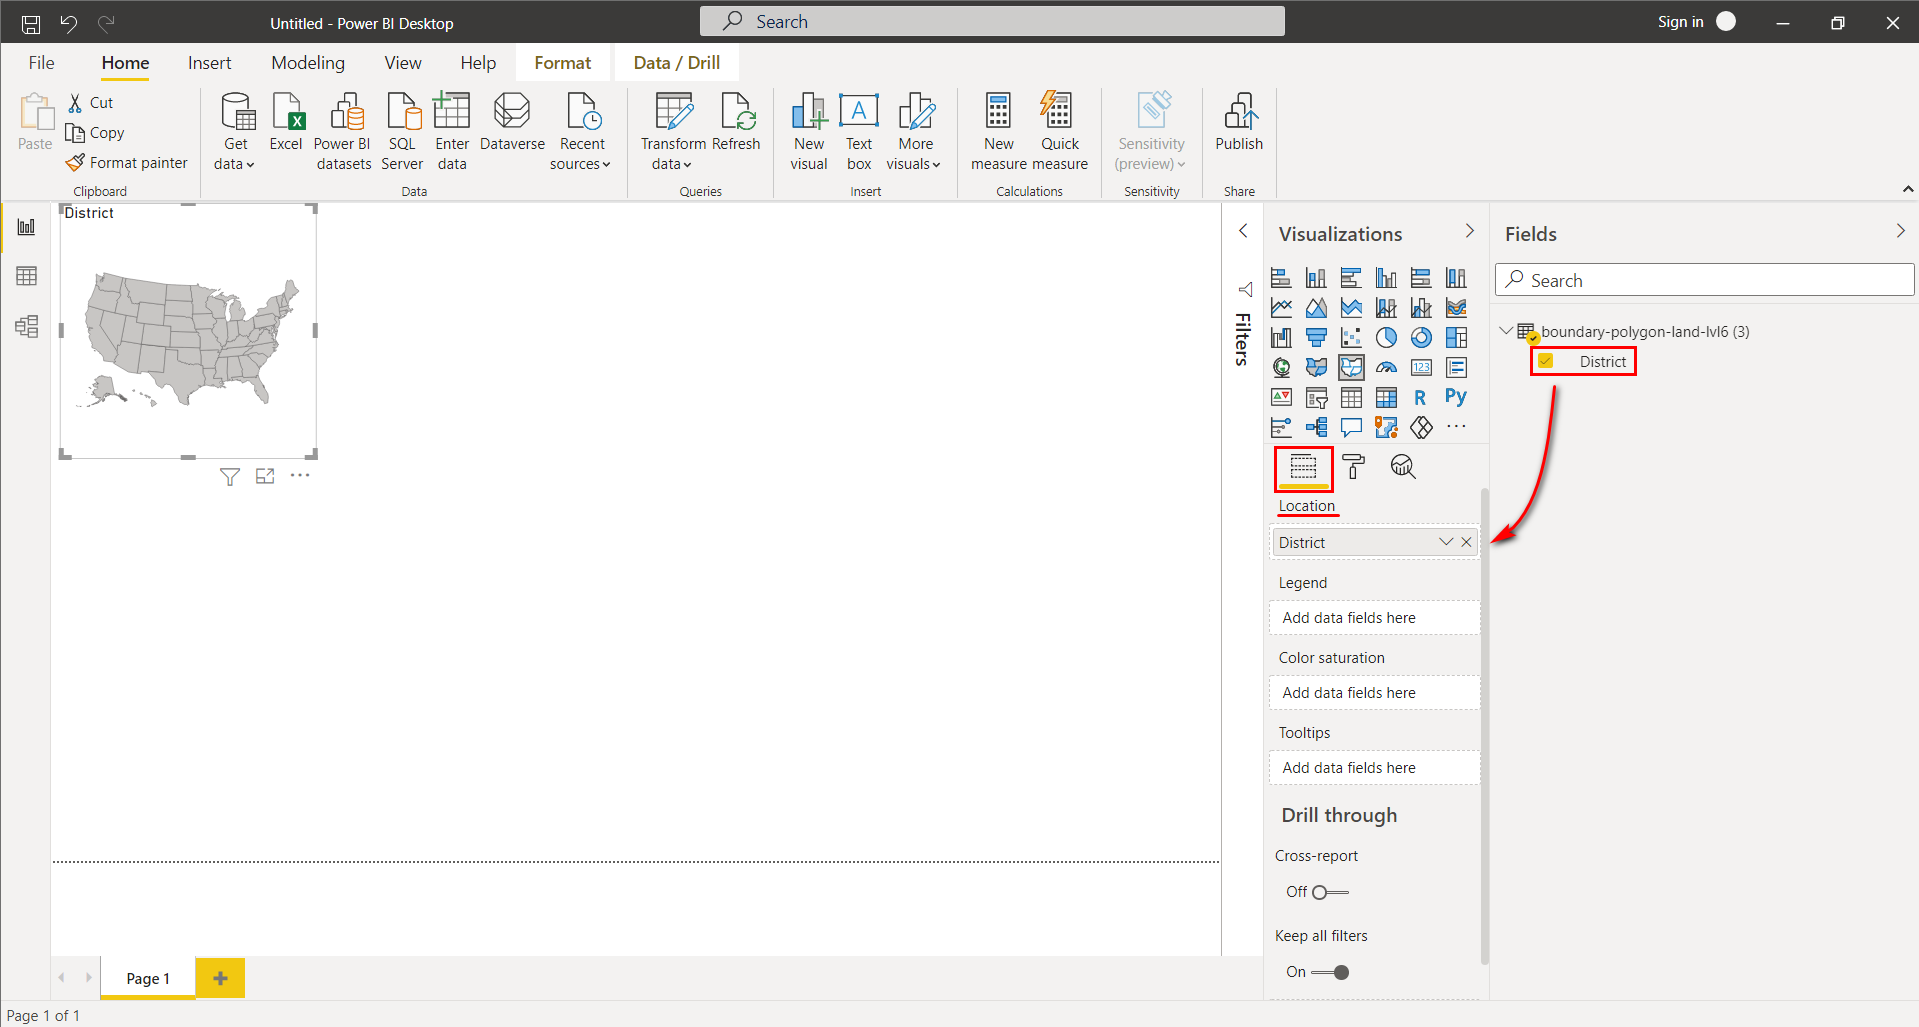
Under “Visualizations” panel select “Format” tab > “Shape” > “+ Add map”. In the pop-up window specify path to TopoJSON file.

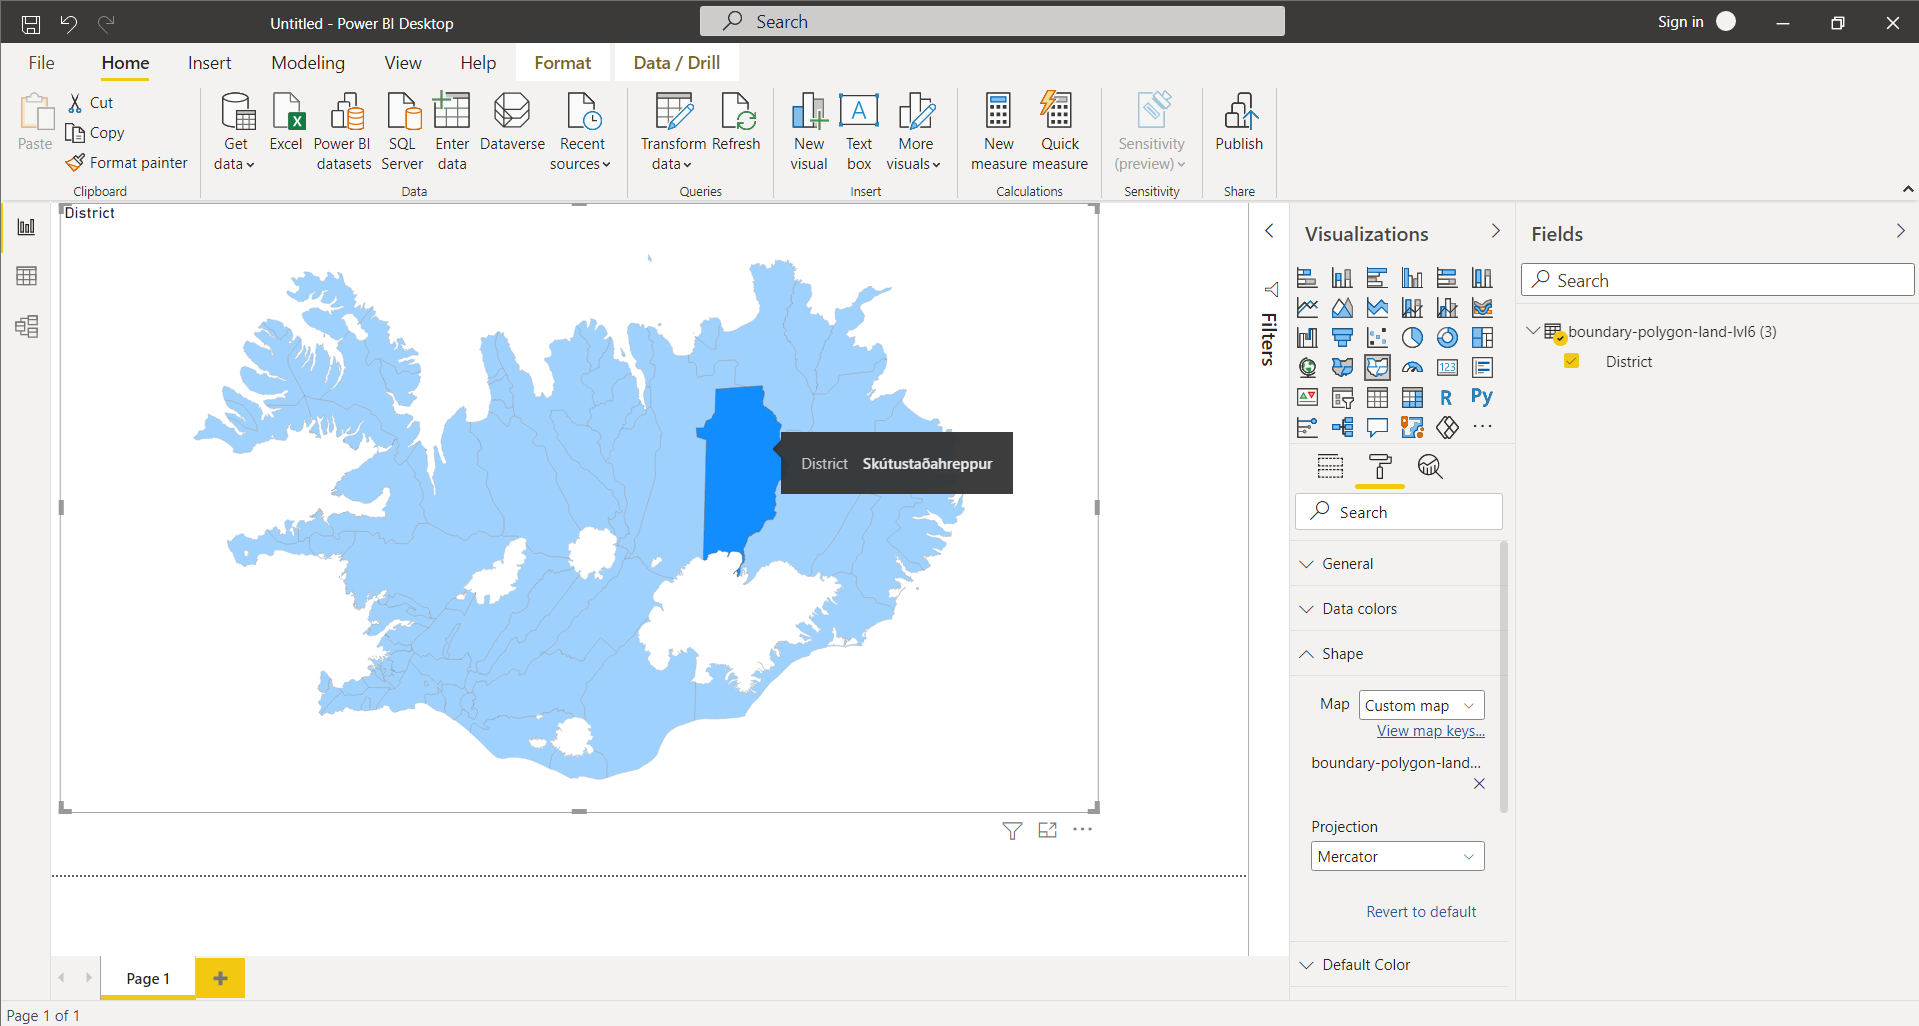
Layer is loaded into workspace.