Как подключить данные в D3 (d3.js)
Закажите данные на интересующую Вас территорию в формате GeoJSON.
Дождитесь получения результата, скачайте и распакуйте архив с данными.
Выберите нужный слой, например Границы муниципальных районов (boundary-polygon-lvl6.geojson)
Чтобы подключить слой в D3, нужно его захостить (положить туда, где он будут доступен по гиперссылке).
Код описывающий простую карту, включающую слой муниципальных районов, выглядит следующим образом:
 <!DOCTYPE html>
 <html>

   <head>
     <meta charset="utf-8" />
     <meta name="viewport" content="width=device-width, initial-scale=1" />
     <title>Show Data layer on the D3</title>

   <script src="https://cdnjs.cloudflare.com/ajax/libs/d3/7.3.0/d3.min.js"></script>
   <style>
     #content .map path {
       fill: #aaa;
       stroke: #fff;
     }
   </style>
 </head>

 <body>
   <div id="content">
     <svg width="620px" height="600px">
       <g class="map"></g>
     </svg>
   </div>
   <script>
     // scale - Множитель масштаба проекции
     // center - Центр проекции [долгота, широта]
     // translate - Положение центра проекции в пикселях [x, y]
     let projection = d3
       .geoMercator()
       .scale(10000)
       .translate([200, 280])
       .center([39.5, 44.3]);

     let geoGenerator = d3.geoPath().projection(projection);

     function handleMouseover(e, d) {
       let pixelArea = geoGenerator.area(d); // Площадь в пикселях
       let bounds = geoGenerator.bounds(d); // Границы объекта
       let centroid = geoGenerator.centroid(d); // Центроид объекта
       let measure = geoGenerator.measure(d); // Длина объекта

       d3.select("#content .info").text(
         d.properties.NAME +
           " (path.area = " +
           pixelArea.toFixed(1) +
           " path.measure = " +
           measure.toFixed(1) +
           ")"
       );

       d3.select("#content .bounding-box rect")
         .attr("x", bounds[0][0]) // Координата x левого верхнего угла
         .attr("y", bounds[0][1]) // Координата y левого верхнего угла
         .attr("width", bounds[1][0] - bounds[0][0]) // Ширина
         .attr("height", bounds[1][1] - bounds[0][1]); // Высота

       d3.select("#content .centroid")
         .style("display", "inline")
         .attr("transform", "translate(" + centroid + ")"); // Позиция центроида
     }

     // Вспомогательная функция для переворота координат, если площадь полигона отрицательная
     function fixCoordinates(coordinates) {
       return coordinates.map(function (ring) {
         if (d3.polygonArea(ring) < 0) {
           return ring.reverse(); // Переворот координат
         }
         return ring;
       });
     }

     function update(features) {
       features.forEach(function (feature) {
         const geometryType = feature.geometry.type; // Тип геометрии
         const coordinates = feature.geometry.coordinates; // Координаты

         if (geometryType === "Polygon") {
           feature.geometry.coordinates = fixCoordinates(coordinates); // Исправление координат полигона
         } else if (geometryType === "MultiPolygon") {
           feature.geometry.coordinates = coordinates.map(fixCoordinates); // Исправление координат мультиполигона
         }
       });

       let u = d3.select("#content g.map").selectAll("path").data(features);

       u.enter()
         .append("path")
         .attr("d", geoGenerator) // Создание пути
         .on("mouseover", handleMouseover); // Добавление события при наведении
     }

     // ЗАПРОС ДАННЫХ
     d3.json(url).then(function (json) {
       update(json.features); // Обновление данных
     });

   </script>
 </body>
</html>
Расширенный пример можно посмотреть здесь.
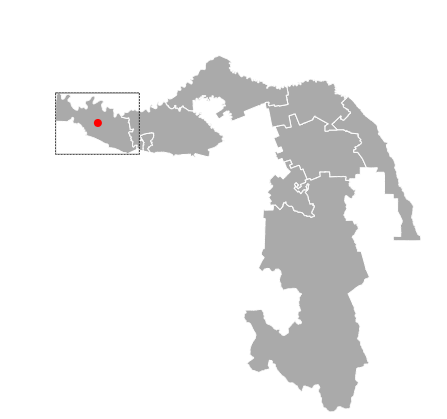
Результат: